Properly leveraging relevant data can improve outcomes for both long-term projects and short-term tasks. While data applications vary by field and purpose, community data consistently serves as a strategic tool. Local governments might use it to forecast population and financial trends, or identify gaps in residential services, while nonprofits can apply targeted measures to set priorities or track progress. In any context, the right data is a key element of effective strategy.
Community Data Housed at Greater IC
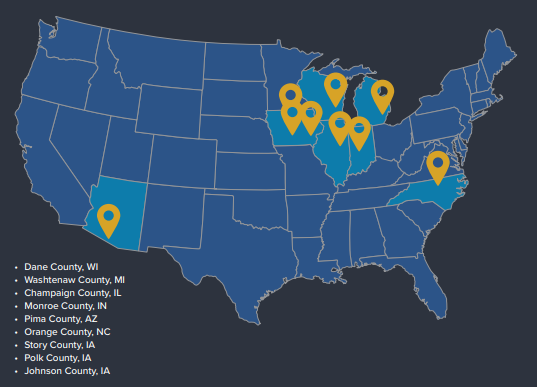
Greater Iowa City, Inc. uses community data to guide initiatives, strategic investments, and decision-making. In 2024, we released our first Data Digest for Johnson County, featuring 31 benchmark metrics to track local progress and compare our county to 8 similar areas. This report’s data ensures our work aligns with demonstrated community strengths and needs.
With the first year of benchmarks in place, our 2025 data collection is underway. This year’s data delivery will take a slightly different form from last year’s report.
Our New Approach to Data Delivery
Data can be communicated in many modes, and no single method works best for every audience. Visual tools such as tables, charts, and graphs are often the most effective. In our 2024 Data Digest, we presented information in a static report, primarily using bar graphs and tables.
For 2025’s data release, Greater IC will transition all data from the printed 2024 Data Digest to an interactive, online data dashboard available 24/7 and hosted on our website and include relevant highlights in our annual report. This dashboard will feature all components from the 2024 Data Digest:
- 31 data measures
- 9 counties
- Up to 10 years of historical data trends
By transitioning the data from a still report to an interactive dashboard, users will be able to:
- Download data directly from our website
- Filter data by year, county, or data measure
- Compare Johnson County to similar counties using graphs, tables, or charts
- Visualize data through a different mode than report-style
Case Studies: Learning from Current Dashboards
By hosting a data dashboard on our website, Greater IC will join many governments, organizations, and entities across the state and country that make their data accessible to the public.
An imperative step in the project’s planning process includes identifying relevant case studies and precedents to help guide our own dashboard creation.
Below is a list of other partnerships, organizations, and governments that host a publicly accessible data dashboard on their webpage. Click the links to explore and interact with each.
1- Greater Des Moines Partnership: Data Hub
The Greater Des Moines Partnership is the economic and community development organization that serves 12 counties in the greater Des Moines area.
The Data Hub hosted by the Partnership includes thousands of different measures in the areas of workforce, demographics, transportation, income, and many more. Users can utilize the DSM USA dashboard to find data for the DSM region and component counties.
2- Iowa Workforce Development: Local Area Unemployment Statistics (LAUS) and Quarterly Census of Employment and Wages (QCEW)
Iowa Workforce Development (IWD) is a state agency committed to providing employment services for individual job seekers and to serving employers by helping them find the skilled workforce they need.
IWD hosts two primary data dashboards on their website: LAUS and QCEW. Both dashboards allow their audience to navigate each set of data by time and includes all counties in Iowa. Their dashboard uses Tableau Public, a free data visualization tool for governments, nonprofit organizations, and individuals seeking low-cost visualization options.
3- Leading on Opportunity: Opportunity Compass
Leading on Opportunity supports Charlotte, North Carolina on its generations-long journey to improve economic mobility for all. They use strategy, policy, and data to help partners solve complex social challenges.
Their Opportunity Compass integrates data and storytelling in a visually appealing and effective manner. The dashboard uses untraditional visuals via vertical bar charts with up and down arrows to allow the viewers to see how local data points are changing over time. Rather than drop-down filters, they utilize click-thru filters where the user can select which data point they interact with.
What’s Ahead for Greater IC
Current and future data housed at Greater IC underscores our commitment to elevating business, investing in strategic initiatives, and advocating for the economic resiliency of greater Iowa City. Our 2024 Data Digest and upcoming interactive data dashboard are clear examples of this mission in action.
To learn about other data housed at Greater IC, contact Evan Doyle, Community and Economic Development Program Manager, at evan@greateriowacity.com.
Want to help shape a region where more people choose to live, work, and grow? Join us. Visit Greater Iowa City, Inc. or connect with us on LinkedIn.