Greater Iowa City, Inc.’s Market Characteristics data provide a snapshot of the population involved in our local economy. These metrics help us understand who lives in our community, the size and strength of our workforce, and the level of educational attainment among workers. Each of these metrics is a key factor in evaluating the region’s overall economic health and future trajectory.
Population & Workforce Trends
Johnson County’s population grew by roughly 16% over the past decade. With an average annual growth rate of 1.46%, the population increased from 134,034 residents in 2013 to 154,881 in 2023.
Over the same period, the working-age population (ages 15–64) declined slightly, falling from 74.2% to 70.8%. While this shift reflects several factors including an aging population, Johnson County still maintains a significantly higher share of working-age residents compared to both the U.S. (64.9%) and Iowa overall (63.2%).
The “living and employed” metric reflects the percentage of individuals who both live and work within the same county. In Johnson County, 66% of residents who are in the labor force also work locally, while 34% commute outside the county for employment.
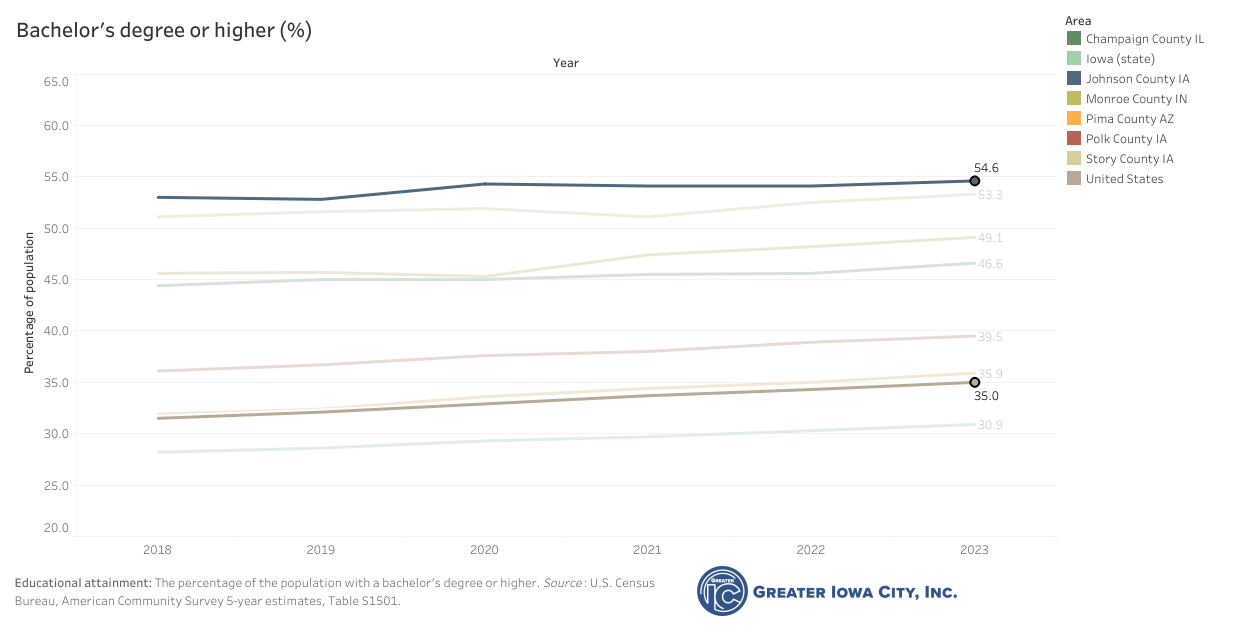
One of the region’s defining strengths is its highly educated workforce. In Johnson County, 54.6% of residents hold a bachelor’s degree or higher, far exceeding the national rate of 35%.
Understanding Household Income
Among the metrics tracked by Greater IC, household income stands out as one of the most important indicators of regional economic health. In particular, it provides insight into overall prosperity and long‑term economic resilience. However, income data can be difficult to interpret without understanding the nuances behind it. A single “average” number often masks meaningful differences in how various segments of the community are doing.
To make income patterns more understandable, Greater IC analyzes the mean household income by quintile, breaking the community into five equal-sized income groups to show how each segment has changed over time.
Key Takeaways on Household Income
The highest quintile, which is the top 20% of households, has experienced dramatic income growth over the past six years. In contrast, the remaining quintiles have seen only modest or stagnant increases. This pattern mirrors statewide and national trends, where the wealthiest households have benefited most from state and federal tax changes. The graphs below show changes to the mean income of the highest (left) and lowest (right) quintiles of income earners. Johnson County is represented by the blue line in both graphs.
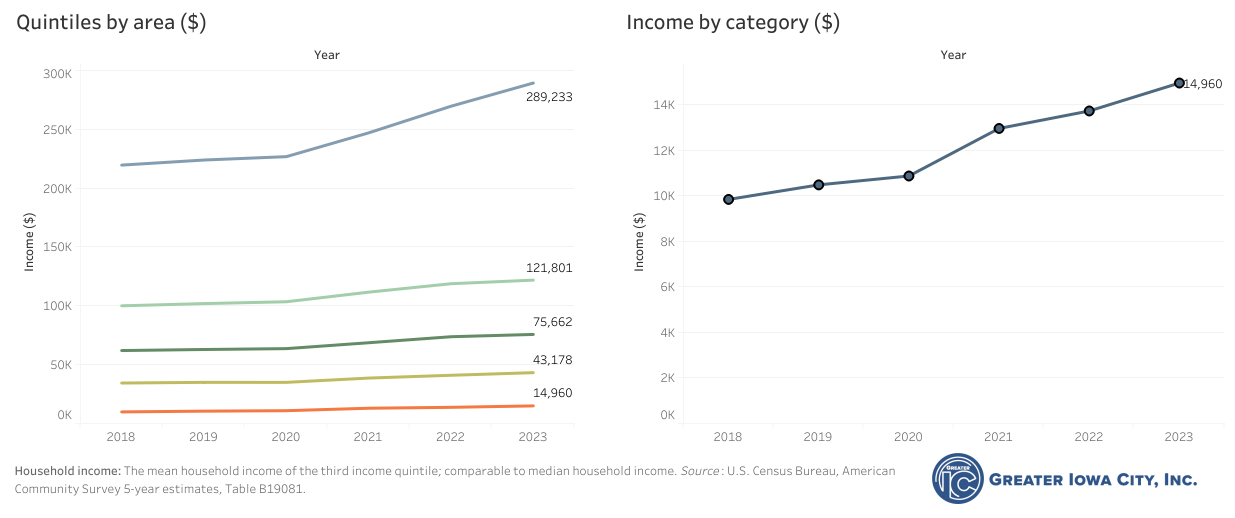
At the other end of the spectrum, the lowest quintile, which is the 20% of households making the least, earns just $15,000 per year on average. These households face significant challenges in meeting basic needs and often rely on the local social safety net for support.
According to data from the Bureau of Labor Statistics from 2018 to 2023, U.S. prices rose by approximately 21%, a substantial burden for the middle three quintile households (60% of households) whose wages have not kept pace.
Why These Metrics Matter
While local leaders cannot directly influence national or statewide economic forces, understanding these broader dynamics is essential for shaping an effective regional response. In the All‑In-Vision Plan, our community specifically identified the development of an upskilling strategy aimed at raising wages and strengthening the region’s talent pipeline as a cornerstone of building a Thriving and Inclusive Economic Ecosystem (Pillar IV).
In pursuit of this vision, Greater IC, in partnership with the City of Iowa City, Johnson County, United Way of Johnson and Washington Counties, the Community Foundation of Johnson County, 4Cs, and many local businesses have taken strides to increase the wages of childcare workers and to strengthen the regions’ ability to attract and retain a strong workforce.
For more information and to see how Johnson County performs relative to other communities, please see our 2025 Data Digest report and our interactive Community Data Dashboard.
Explore our Community Data Dashboard >>>